

LogLikelihood Ratio test for POD ceiling
It is unwise to assume that the POD vs size plot always goes to POD = 1 without verifying that the data support that assumption. Datasets included with the STANDARD mh1823 POD package include the infamous NTIAC 1997 A9002-3-L. The standard analysis produces a warning:
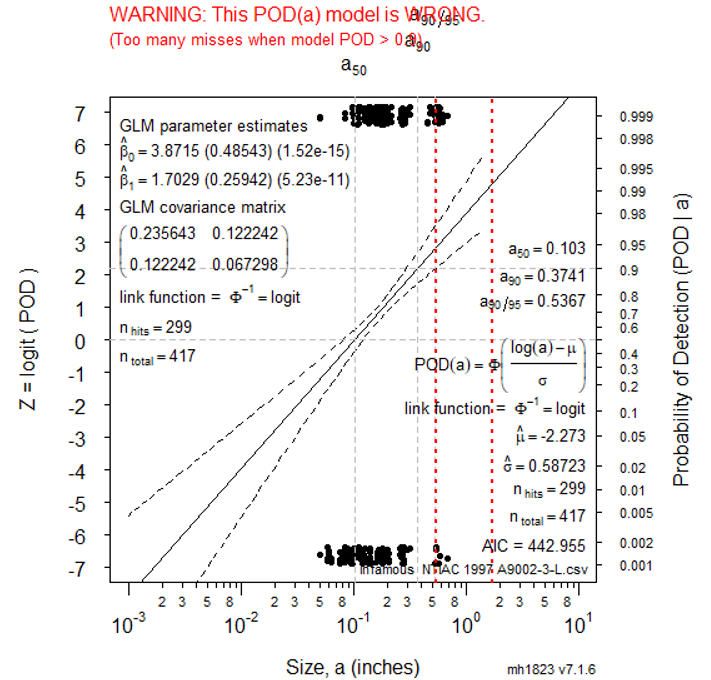
The STANDARD software uses a preliminary test for floor or ceiling: Does the 90% POD catch 90% of the cracks larger than a90? This is a very basic test and can be unreliable.
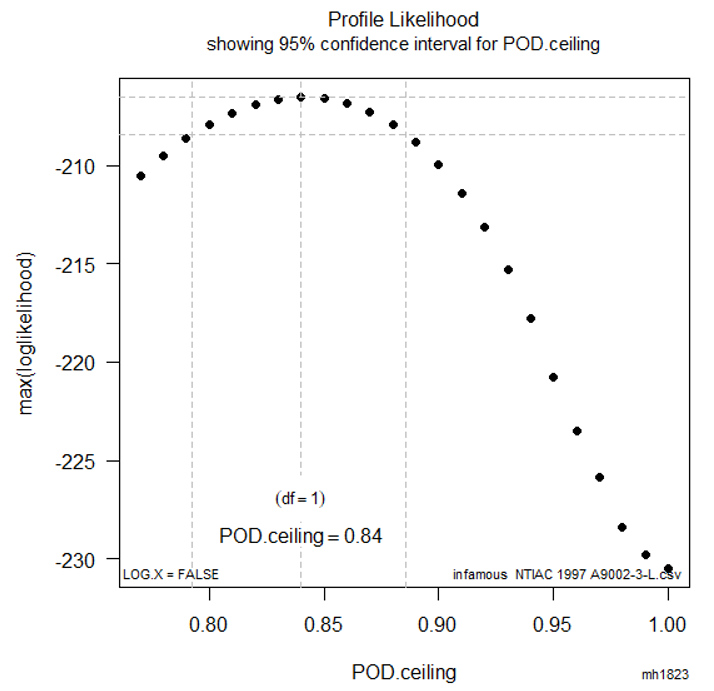
The profile loglikelihood plot shows the maximum achievable loglikelihood for a series of possible values for the upper POD asymptote (“ceiling”).
Profile loglikelihood plot showing upper POD asymptote = 0.84
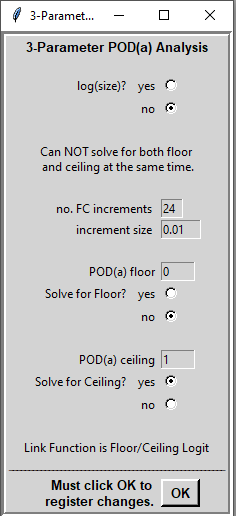
With the workshop Edition software making a profile loglikelihood plot is straightforward: Choose Use 3-parameter POD(a) function from the menu. This will open another menu:
Make to plot and complete your analysis using methods discussed on the Workshop.
Completing the analysis:
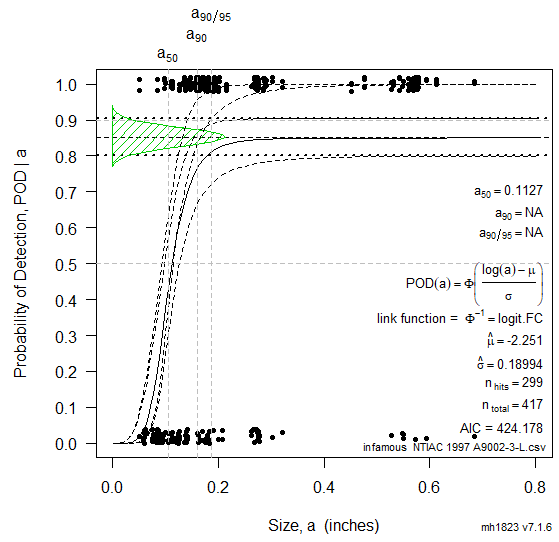
The Workshop Edition software also finds POD “floor.”