POD Floor-Ceiling
POD Floor and Ceiling
Some data do not support …
… a POD curve that goes to zero on the left, or to one on the right.
That means (but perhaps not as obviously as it should) that the standard POD(a) model with asymptotes at zero and one won’t fit the data.
For situations with a data “floor” (a non-zero lower asymptote) or a data “ceiling” (an upper asymptote less than one) we must use a model having the appropriate characteristics, shown in Figure 1.
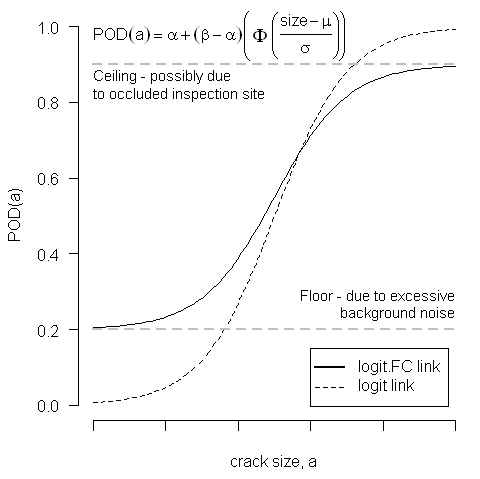
Figure 1 – POD(a) Model with “floor” \((\alpha)\) and “ceiling” \((\beta)\)
POD floor and ceiling
Notice in Figure 2 that there is a handful of very small cracks that are reported as “hits,” the consequence of a corrupting background signal (e.g. “noise”). That means that the lower value of POD cannot be zero. And that means that the standard POD(a) model won’t work. (Well, you can force it to give you an answer, but it will be wrong, as we shall see.)
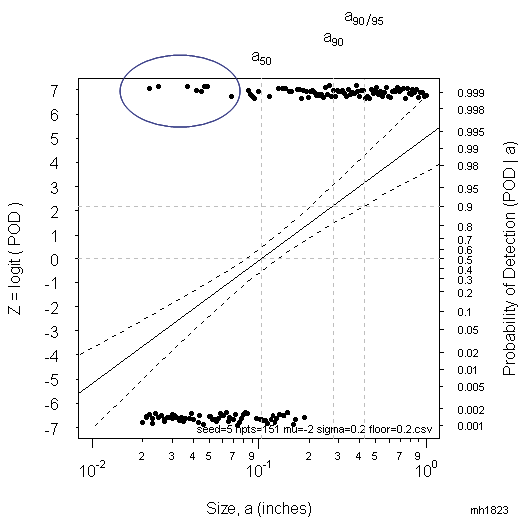
Figure 2 – Data inappropriately described without a POD “floor.”
OK. So who cares about the lower left? We’re interested in the upper right.
Ignoring the non-zero lower asymptote produces an overall poor fit because the model tries to compensate for the poor fit on the lower left with a shallow slope. That, in turn, causes a lousy fit at the upper end as well. This results in a \(a_{90/95}\), the cracksize with 90% probability of detection and 95% confidence, that is too large, and is incorrectly computed to be 42.
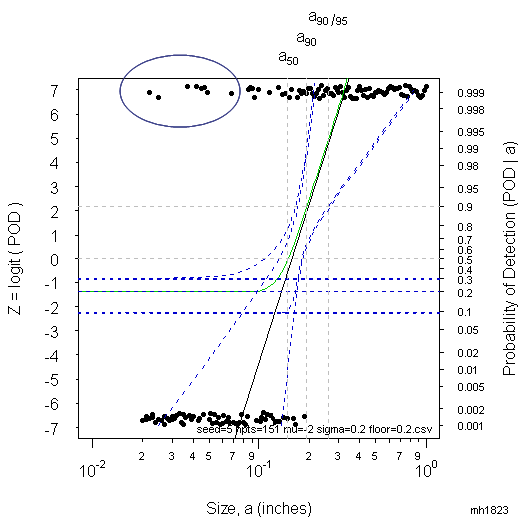
Figure 3 – Data is now correctly described using a POD “floor.”
With the POD floor modeled correctly the overall fit is greatly improved and \(a_{90/95}\) is 28, as seen in figure 4.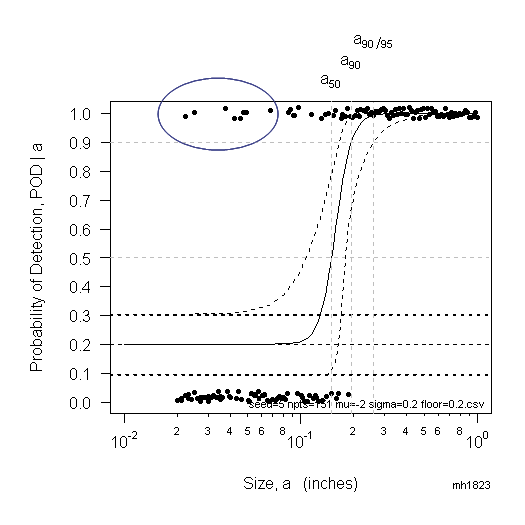
Figure 4 – The correct model plotted on a POD grid.
What to Remember:
While the statistical methods in MIL-HDBK-1823A work in the large majority of situations, they do not work in all situations. When the model (any mathematical model, not just a POD model) doesn’t have the same characteristics as the data, then it is the wrong model. Yes, you can torture the software to use it anyway, but your answer will be wrong. No verbal legerdemain can trick Mother Nature, and if you insist on trying (so you can check the box and move on), ultimately she will have her revenge.
The Standard mh1823 POD Software has rudimentary capabilities for detecting a POD ceiling by computing the observed fraction of misses for targets larger than a purported \(a_{90/95}\) and comparing that empirical POD with POD = 90%. The new 2018 Workshop Addendum can compute a POD Ceiling (or Floor), and confidence bounds for it, plus the Akiake Information Criterion, and Schwarz Criterion for statistical significance.
If your data suggest that their POD minimum value never reaches zero, or their maximum doesn’t approach one, you will need the 2016 POD Workshop Addendum software to model a POD Floor or Ceiling with a 3-parameter model having a lower asymptote (POD > 0) or an upper asymptote (POD < 1).
The advanced POD Workshop Software is an integral part of the 2-day POD Workshop and Short Course.
