

Probability and Likelihood
Probability and Likelihood – looking through the other end of a telescope.
Probability:
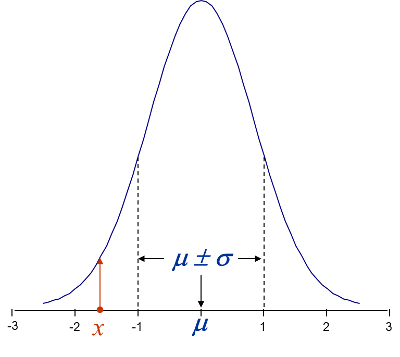
Figure 1 – Probability density showing the probability that an observation will fall between two given values of \(x\). The red ordinate shows the (relative) probability of a single observation.
- The probability density function, pdf, tells how probable a value of \(x\) is, given the model parameters, \(\theta\). For example, for a Normal density: \(\theta= (\mu, \sigma)^T\)\[f(x | \mu, \sigma) = \frac{1}{\sqrt{2 \pi}} e^{-\frac12 \left(\frac{x-\mu}{\sigma} \right)^2 }\]
- Probabilities integrate to one.
Likelihood:

Figure 2 – Likelihood function showing the likelihood of the parameter values, \(\theta= (\mu, \sigma)^T\), given the observations,.
\[f(\mu, \sigma | x) = \frac{1}{\sqrt{2 \pi}} e^{-\frac12 \left(\frac{x-\mu}{\sigma} \right)^2 }\](Notice that the likelihood and probability formulations are identical; the only difference is in what is known: probability (i.e. the model parameters) or observed results, \(x\).)
- The likelihood function tells how likely the model parameters, \(\theta= (\mu, \sigma)^T\) are, given the observed value of \(x\).
- Likelihood can be defined for both censored and uncensored data.(Uncensored example shown here.)
- Likelihoods do not necessarily integrate to one.