

“In theory there is no difference between Theory and Practice.
In practice, there is.”
How FORM/SORM is Supposed to Work
part 3 of 4
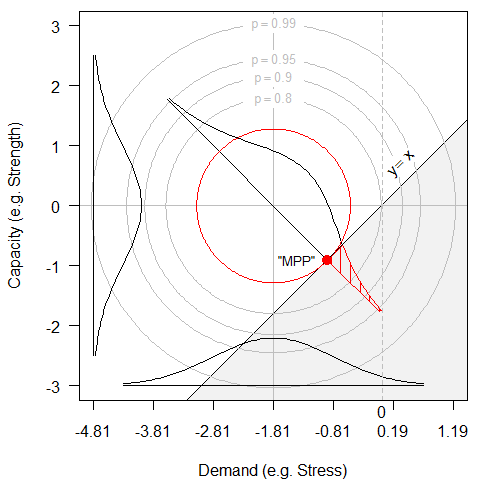
Figure 2 plots the idealized joint bivariate normal probability density of demand and capacity, showing the g-function as the line where capacity=demand+. The density is re-centered at (0, 0).
The bivariate density is bisected by the b vector through the origin to the closest point on the g-function. A standard normal density is plotted along that line, and the probability of the “most probable point” is indicated by the shaded region in the upper left.
The figure shows the 90%, 90%, 95% and 99% concentric circles of the bivariate normal density. The red circle is at a radius of 1.282 standard deviations, and indicates that 10% of the observations would be in the cross-hatched failure region in the upper left formed by the tangent (which is the g-function) to the MPP (red dot).
Notice too that this red circle would contain fewer than half (0.473) of all observations, not 90% as might be guessed. (And this is for a bivariate joint density. As the number of dimensions increases, the hypervolume within b standard deviations of the centroid diminishes exponentially. In 6 dimensions, less than 3% of the total hypervolume would be within 1.282 standard deviations from the centroid, while 3.09 standard deviations would envelop only 20% of the hypervolume, not 99.9%)
Now, our situation is in three dimensions, the Paris Law parameters, C, n, that combine to define capacity, and the applied stress, . The g-function is given by this equation.
\[N=\int_{a_0}^{a_{final}} 10^{-C}\Big(\Delta \sigma \sqrt{\pi a}f(a|geometry)\Big)^{-m} da \tag{3} \]
But these 68 tests were run with = constant, so we can still plot the FORM/SORM results in two dimensions, C, n. Stress is normal to C, n but is constant. The resulting plot is Figure 3, next page.