

Simultaneous Likelihoods
We compared single-value likelihoods elsewhere. In many situations we are interested in likelihood pairs, rather than single values, for example in finding the best slope and intercept of a line.
The likelihood computed at such a parameter (slope, intercept) pair describes a point on a likelihood surface. Or the parameter pair might represent the location and scale of the POD vs size curve, as illustrated in the following figure showing loglikelihood ratio* isoclines (curves of constant likelihood enclosing a given probability). Note that the scale, \(\sigma\), is plotted as its inverse. The relationship of POD model location and scale, (\(\mu, \sigma\)) and the Generalized Linear Model intercept and slope (\(\beta_0, \beta_1\)) are discussed here.
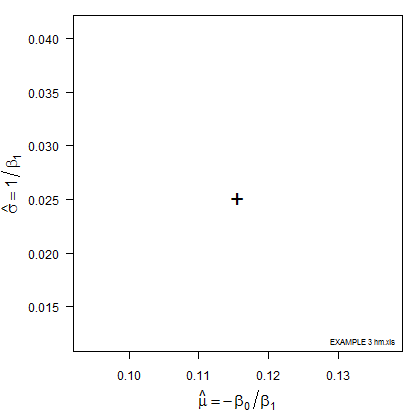
Figure 1 – LogLikelihood Ratio Surface. The triangle identifies the (x, y) pair (location and shape,mu and sigma) whose line is associated with \(a_{90/95}\).
The most likely parameter values are the “+” but other values are also plausible, although less likely. That (x, y) pair produces the best GLM (Generalized Linear Model) fit of the data, shown as the black line in Figures 2 and 3.
Each point along the 95% confidence contour of the loglikelihood surface produces a GLM line (Figure 2) and its corresponding POD(a) fit (Figure 3).
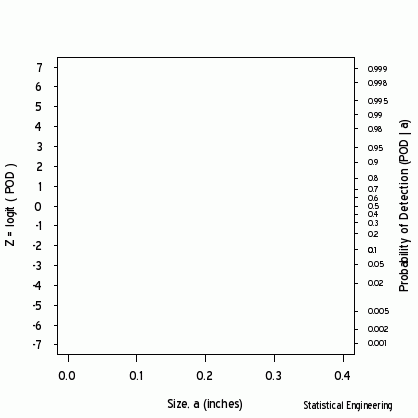 | 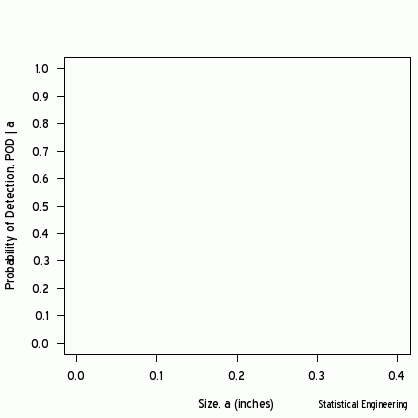 |
Figure 2 - Logit (and POD) vs Size | Figure 3 - POD vs Size |
*Note: While the range of probability must reside between zero and one, \(0 \lt p\lt 1\), likelihood can take on any value, so its value,by itself, isn’t meaningful. The ratio of the log of the maximum possible likelihood to other possible likelihood values is meaningful, especially because it can be related to the Chi-square density.