

NESSUS-FORM
Contrasting the Statistical with the Mathematical
Properties of NESSUS/FORM
Acknowledgement:
This work was sponsored in part by NASA Order No. C-80076A
Program Manager: Dr. Shantaram S. Pai (NASA GRC)
Page 1 of 2
The FORM/SORM Paridigm
Warning: The units are rubber-band yardsticks
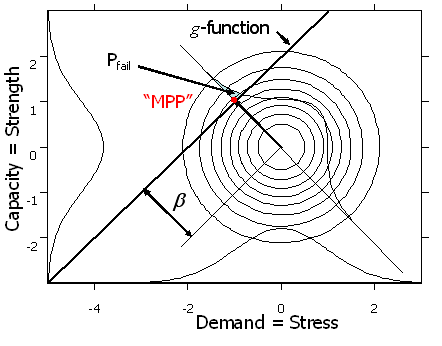
Figure 1 The Form/SORM Paradigm
NESSUS will always see the problem this way, after subtracting the sample mean and dividing by the sample standard deviation.
This work contrasts the statistical and mathematical behavior using 10,000 nominally identical NESSUS/FORM problem evaluations, and observes that for a simple cantilever beam example the average expected number of failures is more than \(50 \times\) the nominal value. Figure 2 presents the simple cantilever beam problem.
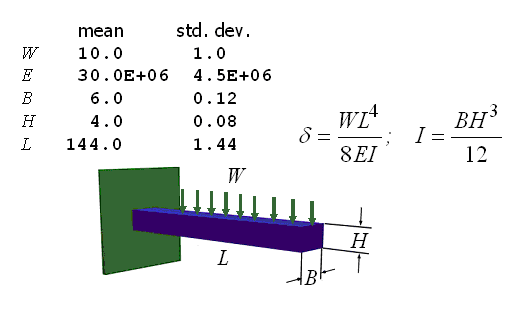
Figure 2 Cantilever Beam Example
The problem defined the nominal case as “truth,” and a NESSUS evaluation of the “known” parameter values provided the “true” result. Since in any real situation the true values would not be known, they would have to be estimated from random samples, as is stated in the NESSUS User’s Manual.
To simulate this, samples of ten were drawn from each of the five “true” marginal probability densities and the sample means and standard deviations were computed and then used in a NESSUS/FORM evaluation of the cantilever beam. The resulting “most probable point” (MPP) was recorded, and then correctly scaled by the “true” means and standard deviations and the “true” probability of failure was then determined as the normal inverse of the beta vector. This process was repeated 10,000 times.
The results demonstrate that the statistical output of FORM calculations can be very different from what might be expected mathematically, such that average probability of failure is almost always underestimated. While this result may be unexpected by practitioners for whom the terms “statistical” and “mathematical” are synonymous, it is entirely consistent with statistical theory well-known in the statistical literature for 100 years.