

“In theory there is no difference between Theory and Practice.
In practice, there is.”
How FORM/SORM is Supposed to Work
part 4 of 4
FORM (First Order Reliability Method) has been used extensively by engineers for several decades. What has been studiously ignored, however, is how well FORM/SORM assumptions hold up in describing real data.
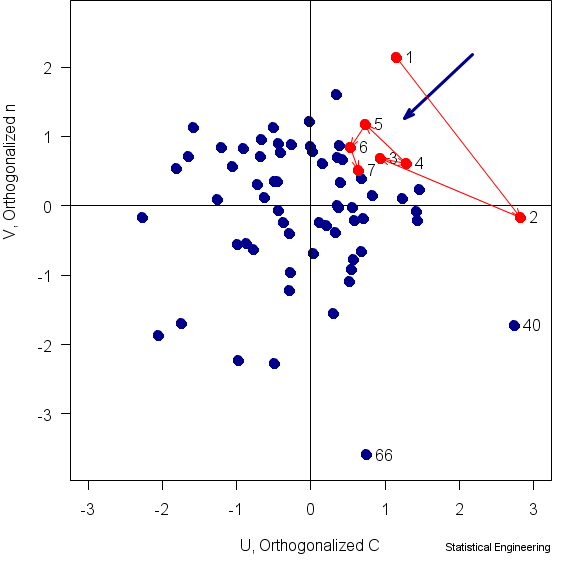
Figure 3 Actual joint bivariate probability density of the two
components of capacity, C, n
Now, our situation is in three dimensions, the Paris Law parameters, C, n, that combine to define capacity, and the applied stress, . But these 68 tests were run with = constant, so we can still plot the FORM/SORM results in two dimensions, C, n. Stress is normal to C, n but is constant. The resulting plot is Figure 3.
Demand is normal to them but, being a constant, has the same value for all points in the plane of the figure. Capacity, however, changes according to the values of C, n. The g-function, which is a line in the Demand-Capacity space, appears here as a point , the “Most Probable Point,” (the blue arrowhead) where this line intersects the
C, n plane.
The 68 points in this figure all lie in a plane such that = constant. The blue arrow is the trajectory from p=1/68=0.0147 to p=7/68=0.1029 in this plane.
Finally we can see how well the FORM/SORM theory performed in the simplest of real situations. Six of the 7 earliest failures (7/68 is approximately 10%) are in the same quadrant as the “10% MPP ” (blue arrowhead) rather than along the arrow*. One of the earliest failures isn’t even in the “right” quadrant.
So What?
We have compared the advertised properties of FORM/SORM with 68 real observations, taken under ideal conditions for such a comparison. In summary, FORM/SORM simply does not work as promised. If it worked, the points would lie along the blue arrow, which they obviously do not.
While it seems reasonable to ask why, that question is much like asking why 2 + 2 doesn’t equal 5. It doesn’t work because it’s wrong. It is based on an appealing, but false premise. It is false because of this fact:
A multivariate normal density relying on estimates for mean vector and covariance based on the data themselves, is not well approximated by trying to section it and then use the one-dimensional normal density to determine probabilities.
This is true even if the data are are not correlated and require no “transformation” to force them to pretend to be normal.
We have demonstrated this with real data. It is possible to demonstrate this with a Monte Carlo simulation, too, but that exercise is left to you, kind reader, to demonstrate it for yourself.
Remember, in your simulation, that the mean vector and the covariance matrix must be estimated from your simulated data, just as is necessary with real data. Furthermore you must sample properly from the joint probability density of controlling influences. That means you must sample from their joint density taking into account their possible covariance. And remember, although you can calculate a sample mean and a sample standard deviation for any sample, that doesn’t imply that the population from which the data came is normal any more than calculating the intercept and slope for a line connecting two points on the circumference of a circle means that the line is the circumference.
Things to Remember:
- \(2+2 \ne 5\)
- FORM/SORM does NOT work.