How Well do POD models work
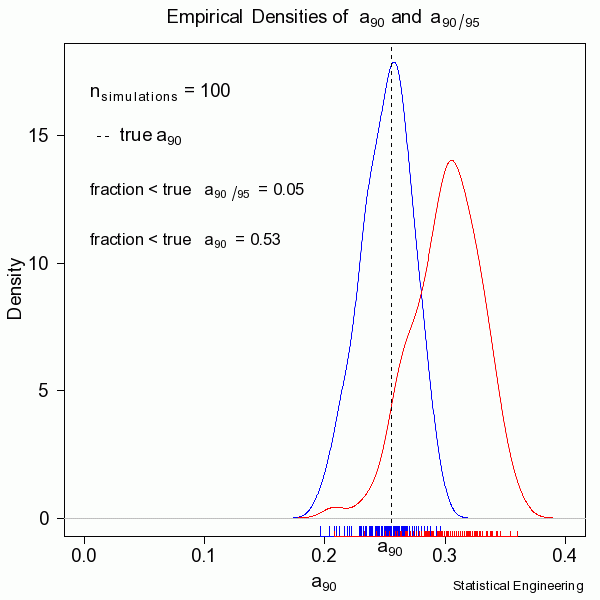
100 simulations produced 100 realizations of the “data” with 100 \(POD \space \textit{vs} \space a\) models, and their associated 95% confidence bounds, and of course 100 realizations of \(a_{90/95}\).
How well does our lower bound calculation work? We advertise 95% converge, i.e. at least 95% of the computed \(a_{90/95}\) values are at least as large as the true \(a_{90}\). With a simulator we know the “true” value so we can compare.
In this random sample of 100 the estimated coverage is 95%, which is the nominal value. Notice that the median coverage is not 50% in this instance, but 47%, due to randomness alone. Another sample of 100 would be insignificantly different in the coverages. With a much larger sample, say 1,000,000 these coverages would be exceedingly close to their nominal values. In reality we only get to see ONE collection of data, and from that must estimate the most likely model for the unseen and unknown and unknowable “truth.”


