

LogLikelihood Ratio Test for POD Floor
The profile loglikelihood plot shows the maximum achievable loglikelihood for a series of possible values for the lower POD asymptote (“floor”). We can construct a similar plot for the upper POD asymptote (“ceiling”).
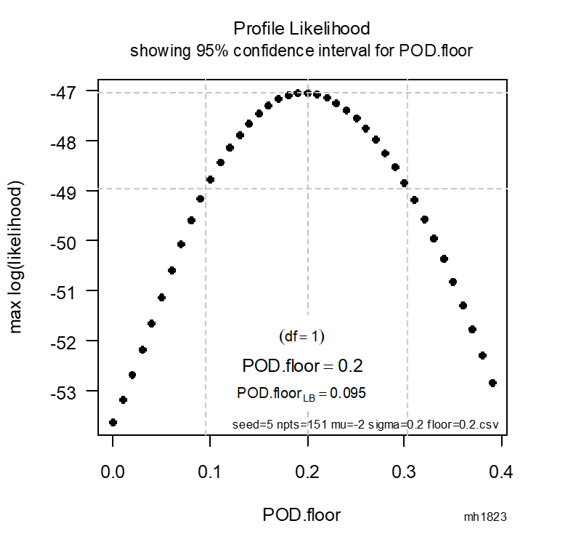
Profile loglikelihood plot showing lower POD asymptote = 0.2
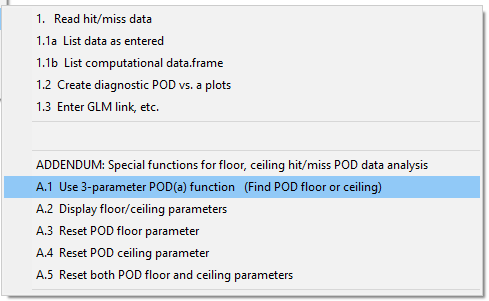
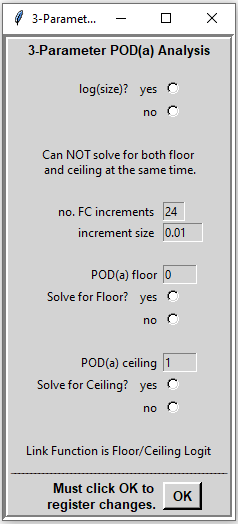
To make a profile loglikelihood plot using the Workshop Edition software, choose Use 3-parameter POD(a) function from the menu. This will open another menu:
Make to plot and complete your analysis using methods discussed on the Workshop.