Workshop ADDENDUM
mh1823 POD Workshop ADDENDUM menu example
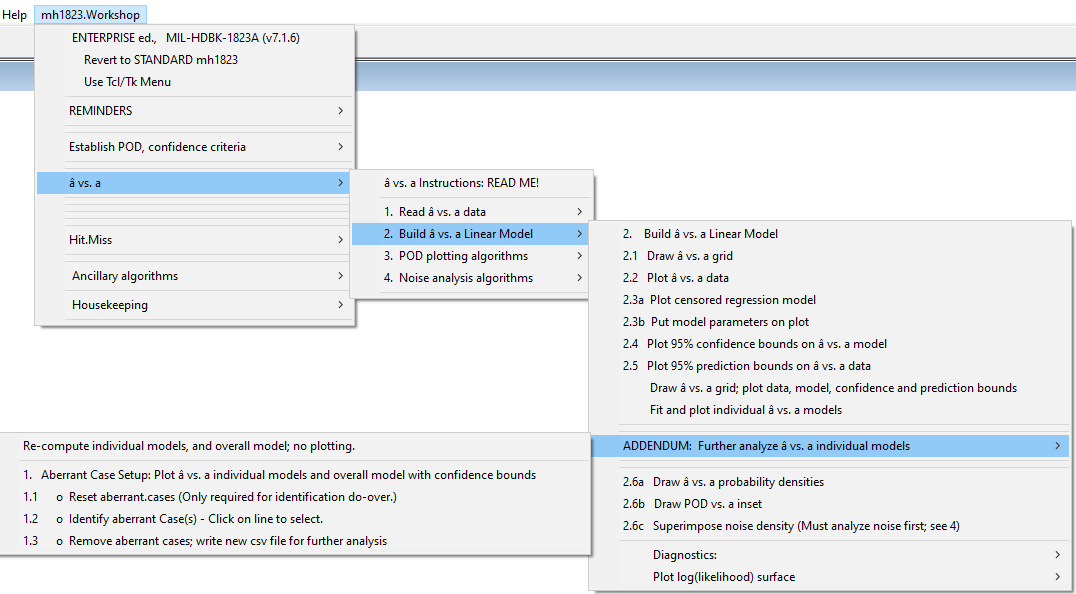
With several different factors in a dataset, (e.g. different inspectors’ results) finding the aberrant factor can be difficult if you only have the color-code to differentiate them. The Workshop software simplifies this considerably by plotting all the Linear Models, then using mouse point & click to identify the offending factor. Here’s how this looks from the Workshop Edition menu:

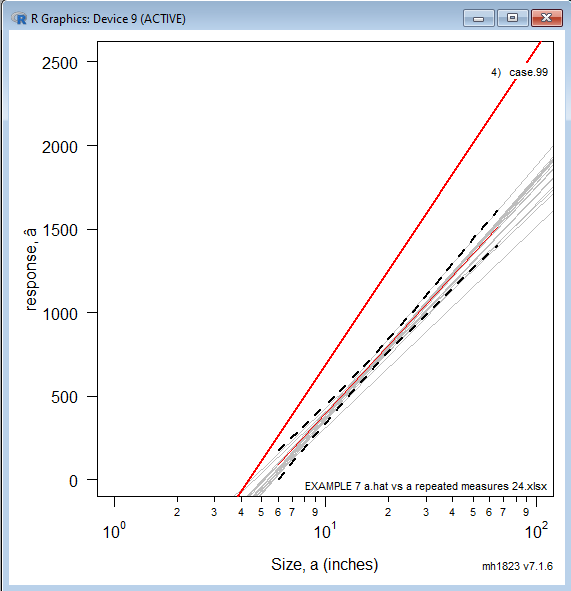
Choosing from the menu, construct this plot by point and click:
identify.all.aberrant.a.hat.vs.a.cases()
################
Click on selected POINTS.
Press ESC button to stop.
################

########## aberrant.cases ###########
(Columns are size, response 1, response 2, ...)
Case No. Header Column No.
4 case.99 5
#####################################
Then create a new dataset minus the offending individuals.
> remove.aberrant.cases()

***************************************************
Is this a good idea? Out of sight - out of mind?
***************************************************


Restructured data is in file:
EXAMPLE 7 a.hat vs a repeated measures 24.xlsx.minus.1.case.csv

NOTE: This new csv file has size in column 1, not 2.
****************************************************
Finally, read the newly created dataset and continue your analysis.

