Correlation
Many people think they know what correlation is – and they’re wrong. Sure, its a measure of how things change together, but it’s much more – and less – than just that.
Correlation measures the strength of a linear relationship between two variables. It’s that never-mentioned, often-ignored, qualifier that can trip you up. You calculate the correlation coefficient and find that it’s low and conclude the two entities aren’t closely related. Boy! Are you in for a surprise!
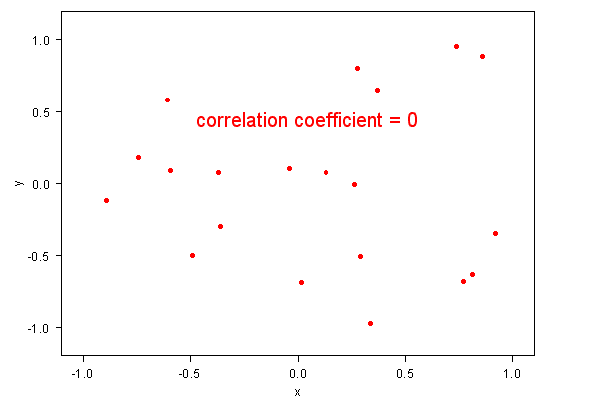
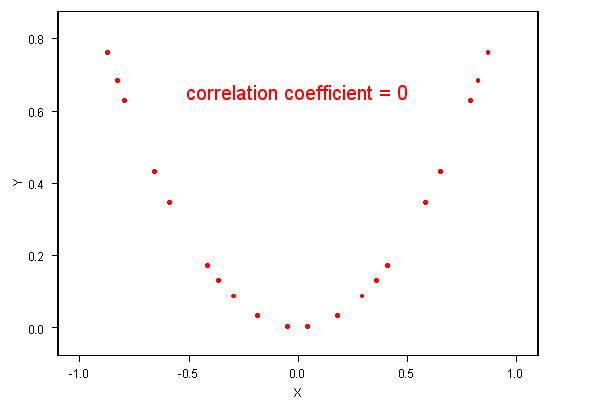
Consider these two plots of \(y \text{ vs } x\). The first is random, and the correlation coefficient is zero. (What’s new?). The next plot shows a perfect quadratic relationship between \(y\) and \(x\). It’s correlation is also zero!

A Random Relationship has Zero Correlation.

But Zero Correlation Does NOT Mean No Relationship.
Find this hard to believe? Here are the data. You can copy them into your own analysis package (like EXCEL, for example) plot them and calculate the correlations for yourself.
|
Zero Correlation Dataset 1 |
Zero Correlation Dataset 2 |
||||||
|
x |
y |
X |
Y |
||||
|
0.3716803 |
0.6396969 |
-0.1833341 |
0.0336114 |
||||
It’s always a good idea to read the fine print, and statistics has a lot of fine print. Knowing that two variables are independent will tell you that their correlation coefficient is zero. But knowing the correlation coefficient to be zero does NOT mean the two variables are independent, or otherwise unrelated. It only means there is no linear relationship.

