Most Probable Point
The great tragedy of science –
The slaying of a beautiful hypothesis by an ugly fact.
– Thomas H. Huxley
Why the “Most Probable Point” Isn’t
First Order, and Second Order Reliability Methods (FORM/SORM) are based on a demonstrably false premise of a “Most Probable Point.”
The concept of a “Most Probable Point” is admittedly appealing and sounds reasonable, but despite its widespread popularity in the engineering community the idea is demonstrably false: There is no “most probable” combination of variables that causes early failure. Furthermore the early failures are observed to result from a wide range of controlling variables, not located near any single “point.”
Fortunately we have some real laboratory fatigue crack growth data that demonstrates this. No “simulations” are needed (although proper MC simulations provide easy corroboration).
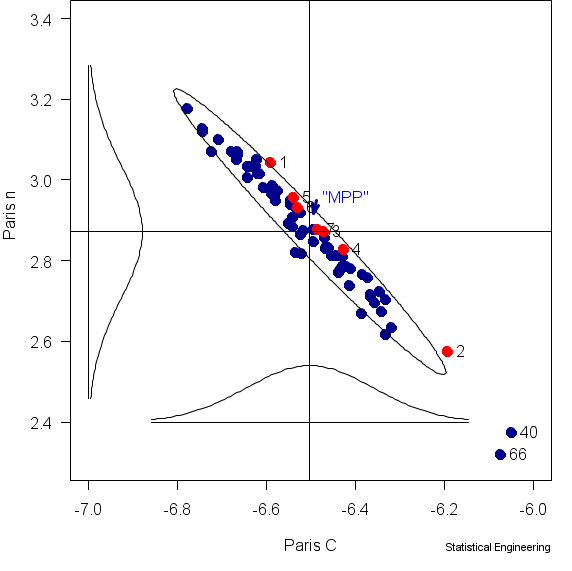
There is some order that unites these early failures. They all occur near the upper arc of the 90% confidence ellipse of their failure-controlling parameters – surely no surprise to any statistician.
So what?
The MPP is a fiction. Early failures do not result from a tiny, point-sized neighborhood of parameter values. Nor do they lie along the trajectory to the MPP, shown in blue. Therefore predictions of conditions causing early failure, based on the demonstrably false premise of a “Most Probable Point,” are most probably wrong.
Details:
In the mid-1970s Dennis Virkler, then a Ph.D. student of Professor Ben Hillberry at Purdue University, conducted 68 crack growth tests of 2024-T3 aluminum. These tests were unusual because they were conducted expressly to observe random behavior in fatigue. While most crack growth tests measure crack length after some number of cycles, Virkler measured cycle count at 164 specific crack lengths. This provided a direct measure of variability in cycles, rather than the usually observed variability in crack length at arbitrary cyclic intervals.
Of the 68 specimens, two seemed exceptional but, there being no reason to exclude them, all 68 specimens were used here. The Paris Law parameters, \(C, n\) were then computed for each of the specimens in the usual way per ASTM 647.
\[da/dN=10^C (\Delta K)^n \tag{1} \]
The Paris Law parameters are related to the specimen lifetime by
\[N=\int_{a_0}^{a_{final}} 10^{-C}\Big(\Delta \sigma \sqrt{\pi a}f(a|geometry)\Big)^{-n} da \tag{2} \]
which can be seen after some algebraic manipulation of the crack growth rate \(da/dN\) so as to integrate over crack length, \(a\), to get the total crack length, and integrate over cycles to get the corresponding cycle count, \(N\).
The \(C, n\) pairs were then plotted and a 90% Wald confidence ellipse constructed around them as shown in the figure. The actual, observed, specimen lives were ranked from shortest to longest and the 7 shortest (approximately 10%) were identified on the figure with their rank.

Paris Law parameters C, n for 68 fatigue crack growth specimens tested under nominally identical conditions, then ranked shortest life to longest, showing the 7 earliest failures (red).
The 90% Wald Confidence Ellipse is also shown. The theoretical “MPP” and its trajectory from less to more probable, is the blue arrow. The red data, obviously not on the blue arrow, show that there is no “most probable point.”
It is clear from the figure that the earliest 10% of the failures do not occur near a single “most probable point.”
Comment:
The figure also plots the marginal densities. It is interesting to note that the two “unusual” specimens had “extreme” values for \(C, n\) yet their lifetime ranks were 40 and 66, one near the median, the other among the longest. Many of the early failures have Paris Law parameters not greatly removed from their respective means, with the shortest life and the next-shortest life having \(C, n\) rather distant from one another, on opposite sides of both marginal means.
These 68 tests were performed as close to being identical as was humanly possible. If the idea of a Most Probable Point cannot work for something as fundamental as 68 identical tests, tested under identical conditions, from the same heat of material, in the same laboratory, by the same Ph.D. student, however could it possibly work in a more realistic, more challenging situation?
All this reinforces the fact that the mathematical dream of a “most probable point” simply is not borne out by real physical laboratory observations, however disconcerting that may be to a true-believer.
Acknowledgement:
I wish to thank Professor Ben Hillberry of Purdue University for graciously making the now famous Hillberry-Virkler data, as well as specimen geometry and testing details, available to me for this study.

