How \(\hat{a} \space \textit{vs} \space a\) Works
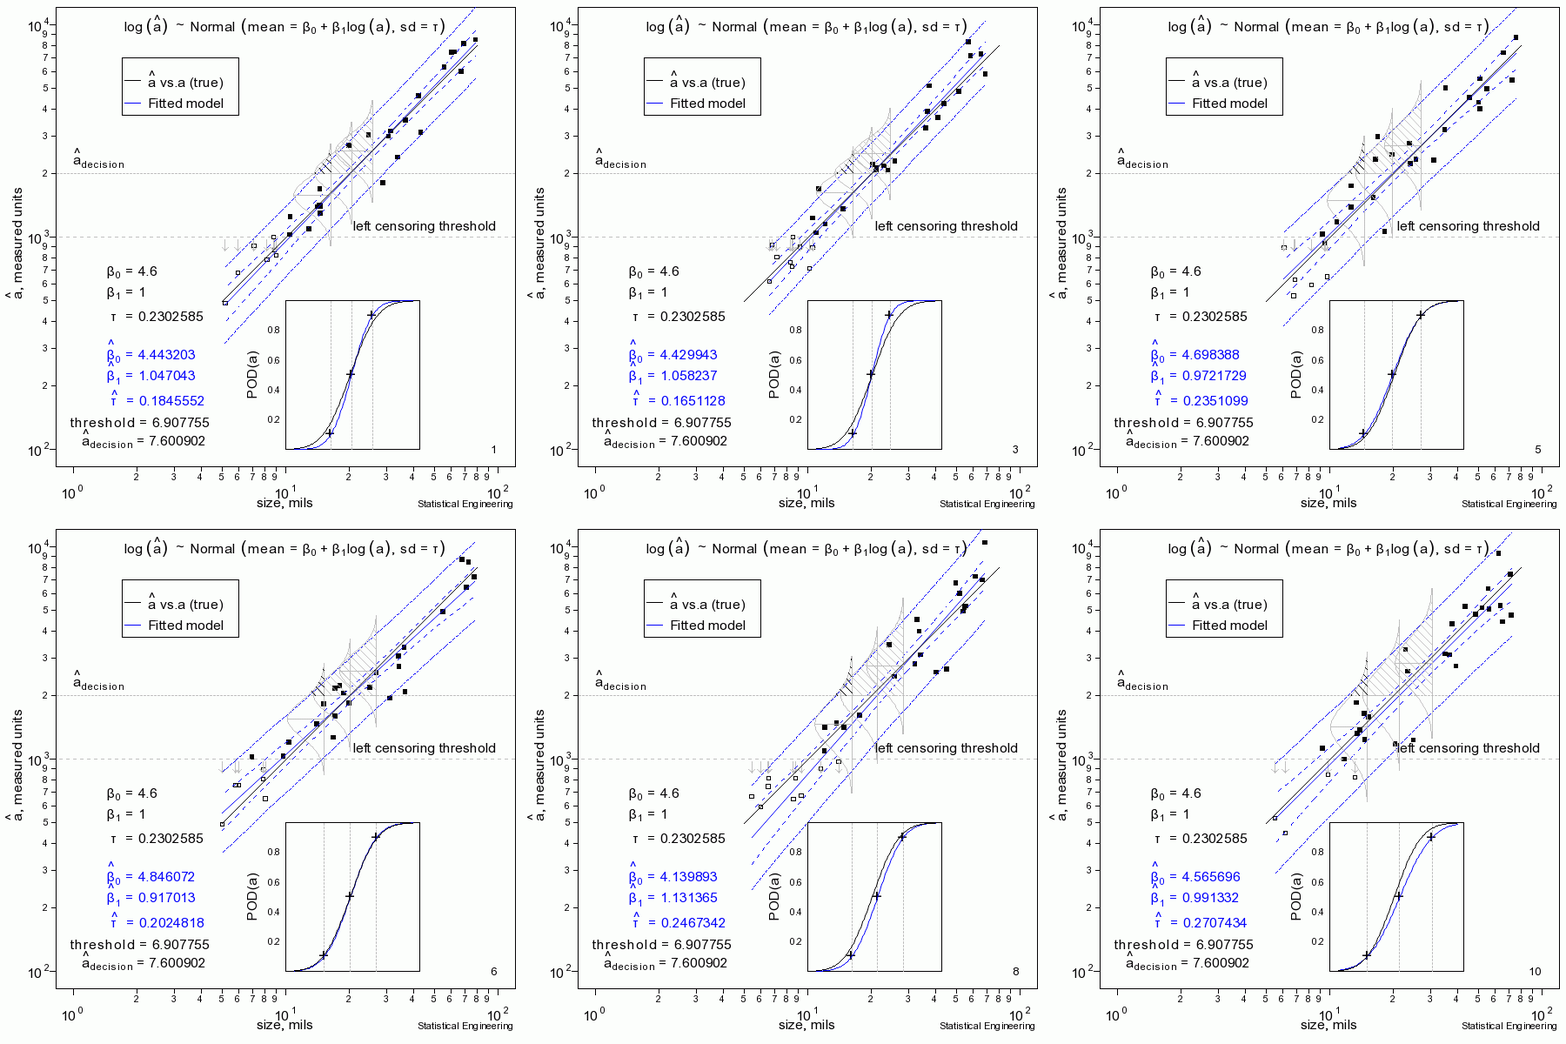
POD (Probability of Detection) is the probability (shown by the shaded region under the probability density) that a signal, (\(\hat{a}\), “ahat”) will be larger than the decision threshold, \(\hat{a}_{decision}\). The inset shows POD plotted on the same size axis as the
“\(\hat{a} \space \textit{vs} \space a\)” line. Note the correspondences at POD = 0.1, 0.5, and 0.9 with the respective shaded probability densities.
Reality is Random:
The solid black line is defined as truth. In reality the truth would be unknown and is to be inferred from the behavior of the data. The solid black “data” points are observations of signal responses for a given size, generated by adding a random Gaussian error to the “true” response at a give size, \(a\). Sometimes the data are “censored.” Censored observations are shown as open symbols.

The figure sequentially presents ten random samples of n=30 and illustrates the magnitude of variability due only to chance.
The “data” (30 \(a, \space \hat{a}\) pairs) are generated and a censored regression is performed to produce the most likely model to have given rise to those observations. That’s the blue line. Also shown are the confidence bounds and prediction bounds (inner and outer dotted lines, respectively.) Sometimes the blue line (the model) is very close to the “truth.” But sometimes it isn’t, as can be seen from another random sample.
In reality we only get to see ONE collection of data, and from that must estimate the most likely model for the unseen and unknown and unknowable “truth,” and produce its confidence bound that includes the true a90 at least 95 times in every 100 similar experiments (were we to run the other 99 experiments, which we cannot).

