Probabilistics 6
“Probabilistics” 6
There is more to Monte Carlo simulation than replacing constants with probability densities.
What went wrong – and Why:
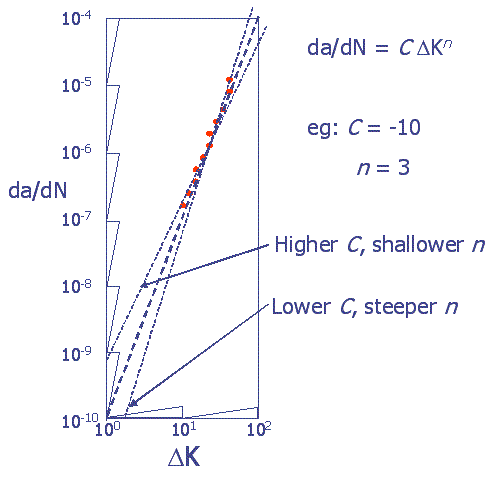
Figure 2 is a schematic plot of crack growth rate vs. stress intensity on a log-log grid. It shows why \(C\) and \(n\) behave in tandem: when the slope, \(n\), is shallow the intercept, \(C\), must be larger for the resulting line to go through the data. Similarly, a steeper slope requires a smaller intercept. A combination of large \(C\) with large \(n\) would produce a curve that passed above the data. A line with having \(C\) with small \(n\) would likewise pass below the data.

Figure 2 – Schematic showing why Paris Parameters must be correlated.
Note that in this schematic the intercept is \(C = \log_{10}(da/dN) = -10, \text{at} \log_{10}(\Delta K)=0\).
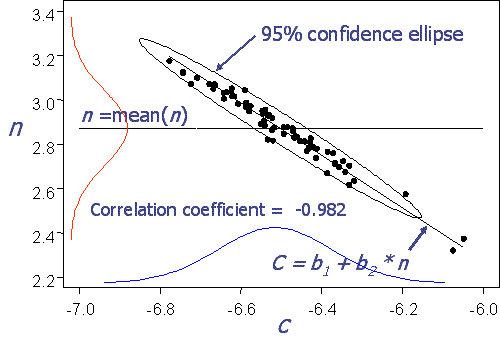
Figure 3 shows why assuming either \(C\) or \(n\) as fixed is not reasonable. The horizontal line is at \(n\) = 2.87, the average of 68 Paris slopes. This is a reasonable value only when \(-6.58 < C < -6.45\). When \(C\) is outside this range, as it will be often, the resulting simulated combination is very, very improbable. In fact observations in either the first or third quadrants (large \(n\) with large \(C\), or small \(n\) with small \(C\)) are exceedingly unlikely in reality but occur about half the time in uncorrelated simulation.

Figure 3- Paris Parameters C and \(n\) are obviously correlated (r=0.982).
Another flawed option for remedy suggests itself since the two parameters are obviously so closely related: let one be a function of the other. A linear fit of \(C = b_1 + b_2\space n\), with \(n\) being sampled from a normal density, does indeed improve things. But this time the resulting error ratio is 0.51, i.e.: the scatter has been over-corrected, and now is underestimated by almost half. Clearly this nonconservative result is also unacceptable.
To summarize:
- Monte Carlo simulation requires more than substituting probability densities for constants.
- Getting the Physics right isn’t enough – Ignoring the statistical interplay among regression parameters can lead to hopelessly inaccurate results.
- All MC simulations can be vulnerable to errors of this kind. The lessons here apply to any regression model, not just to these data, nor only to crack growth behavior.
- Doing the MC simulation right – sampling from the joint density of the model parameters, not from their marginals – is easier than doing it with ad hoc methods whose statistical properties are unknown. (Well, they’re not really “unknown.” They’re awful.)
- Not understanding the nature of the statistical assumptions being made does not mean that they do not exist. Mother Nature doesn’t care if you’re paying attention or not, and she will do what she will, regardless of your calculations.
To download my ASTM paper:
Annis, C., “Probabilistic Life Prediction Isn’t as Easy as It Looks,” Probabilistic Aspects of Life Prediction, ASTM STP-1450, W. S. Johnson and B.M. Hillberry, Eds., ASTM International, West Conshohocken, PA, 2003.
Right-click here, and choose “Save Target As …”

