Weibull Analysis of Component Reliability
The Weibull model is remarkable for being able to provide insight in so many situations.
The Ubiquitous Weibull Model

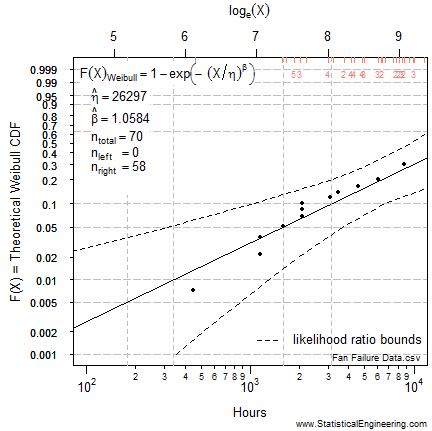
Figure 1 – A Weibull model for describing component failure data, 12 failures and 58 right-censored observations. (Data from Meeker and Escobar (1998), Table C-1)
Observational data can be usefully summarized by fitting it with a probability distribution, like the normal, lognormal or Weibull. For assessing component and system reliability the most widely used is the Weibull distribution.
The figure here describes the fraction failing as a function of service time. There were 70 items on test. 12 failed (shown as black dots) and 58 were removed at various times prior to failure. These are represented by the red tic-mark along the top of the plot. The data are from Meeker and Escobar (1998), Statistical Methods for Reliability Data, Wiley, Table C-1, p630.
The parameter estimates for the Weibull model (solid black line) were determined using the maximum likelihood method. The dashed lines are the 95% confidence bounds constructed using the loglikelihood ratio criterion.
Extreme Value Distributions \(\to\)

