How hit/miss models work
POD (Probability of Detection) as a function of size is less straightforward for binary (yes/no) data when compared with data having a continuous response (\(\hat{a}\)). Grouping data into size bins, and estimating POD as the fraction found in that size range, is inefficient and further suffers from an unwelcome trade-off between resolution in size (smaller size intervals) and resolution in POD (fewer observations in the interval).
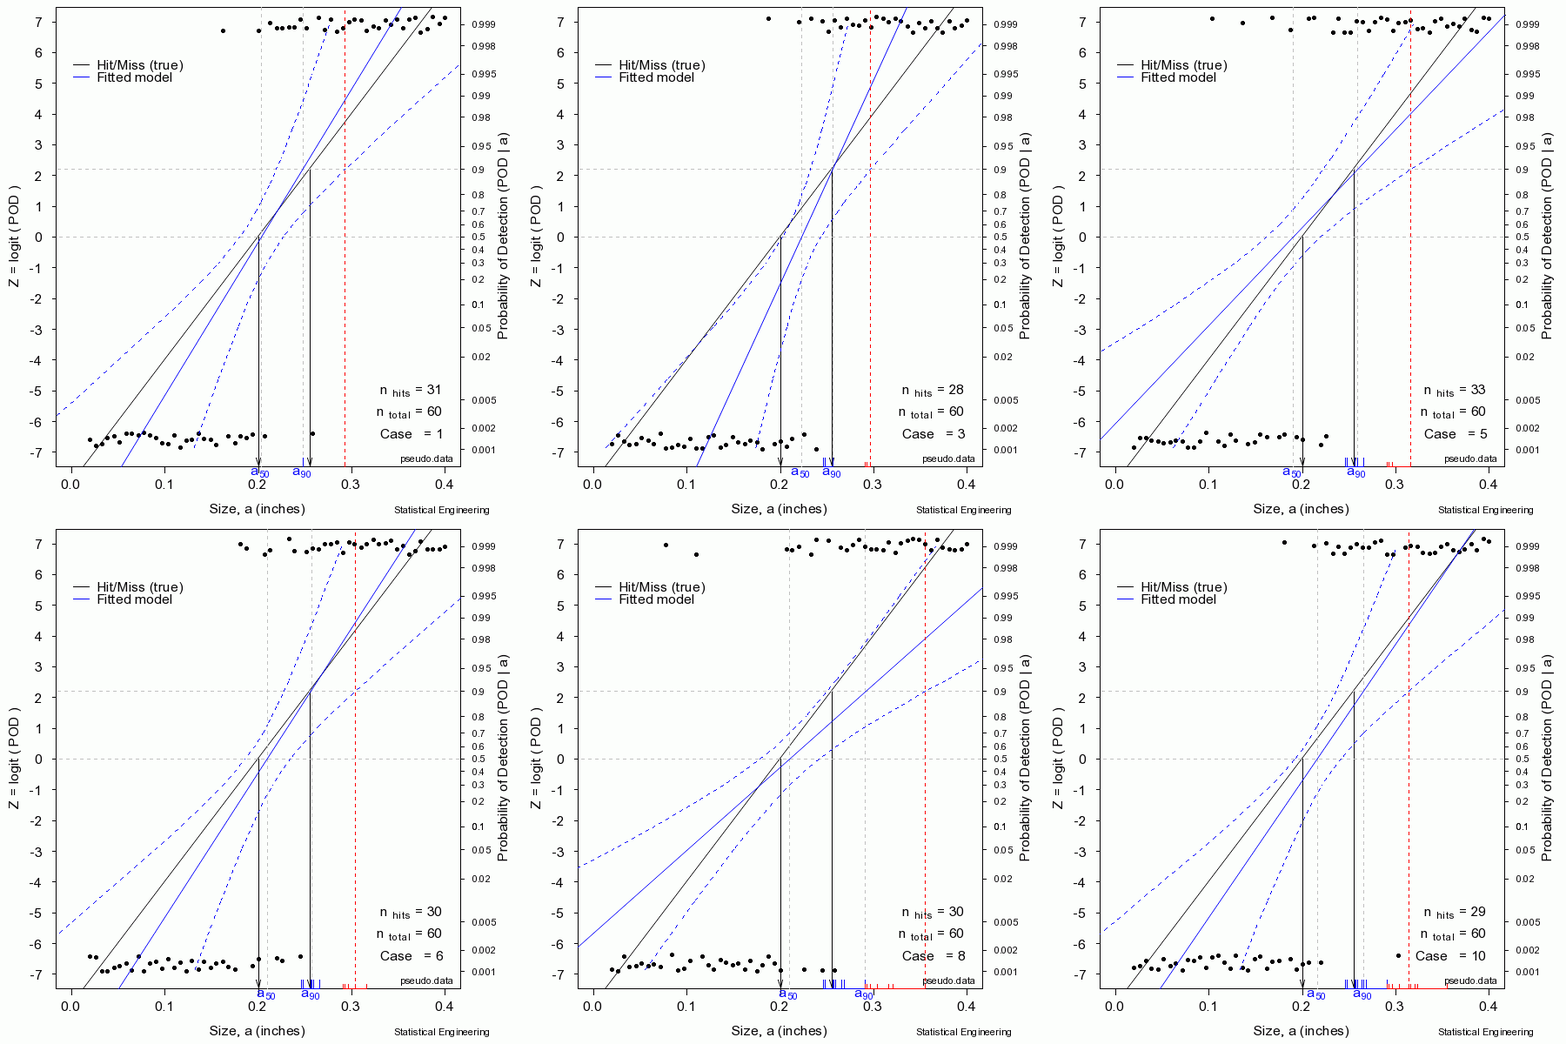
The most effective method for describing binary data is to posit some continuous function, bounded by \(0 \lt y \lt 1\), and then estimating the model parameters using the maximum likelihood criterion. The figure shows POD on the right and the linearizing function Z on the left, and a random sample of 60 hit/miss observations, plotted against target size.

The figure sequentially presents ten random samples of n=60 hit/miss observations and illustrates the magnitude of variability due only to chance.
Reality is random:
The solid black line is defined as “truth.” In reality the truth would be unknown and is to be inferred from the behavior of the data. The solid black “data” points are observations of “hits” or “misses,” ones or zeros, for an inspection with only a binary outcome.
The “data” are generated as a binary response with probability determined by the “truth” at a given size. A generalized linear model is then used to produce the most likely function to have given rise to those observations. That’s the blue line. Also shown are the confidence bounds from which \(a_{90/95}\) can be taken directly (unlike the confidence bounds on \(\hat{a} \textit{ vs a}\) censored regression). Sometimes the blue line (the model) is very close to the “truth.” But sometimes it is not, as can be seen from another random sample.
In reality we only get to see ONE collection of data, and from that must estimate the most likely model for the unseen and unknown and unknowable “truth,” and produce its confidence bound that includes the true \(a_{90}\) at least 95 times in every 100 similar experiments (were we to run the other 99 experiments, which we cannot).

